A Reusable Drawing Toolkit
A Reusable Drawing Toolkit
Over the first three posts we built a small set of Python helpers for drawing molecules and reactions with RDKit: moldraw.py, abbreviations.py, highlight.py, and reaction.py. Each post copied the previous helpers and added something new. By Post 3b the import block looked like this:
from abbreviations import parse_abbreviations
from highlight import draw_highlighted_molecule
from moldraw import draw_molecule
from reaction import draw_reaction
Four separate files, two drawing functions with overlapping parameters, and a DEFAULT_STYLE dict whose keys are raw RDKit option names. In this post, we are going to package everything into a proper Python package called acacia_chem with a single import line, descriptive style parameters, and two new functions: draw_grid for multi-panel figures and draw_batch for bulk exports.
Our example reactions for this post are a series of gold-catalyzed direct alkynylations of tryptophan in peptides using TIPS-EBX. These reactions were found by using De Novo Chem's Saguaro Chem search platform to enumerate the reactions that are reported in this document.
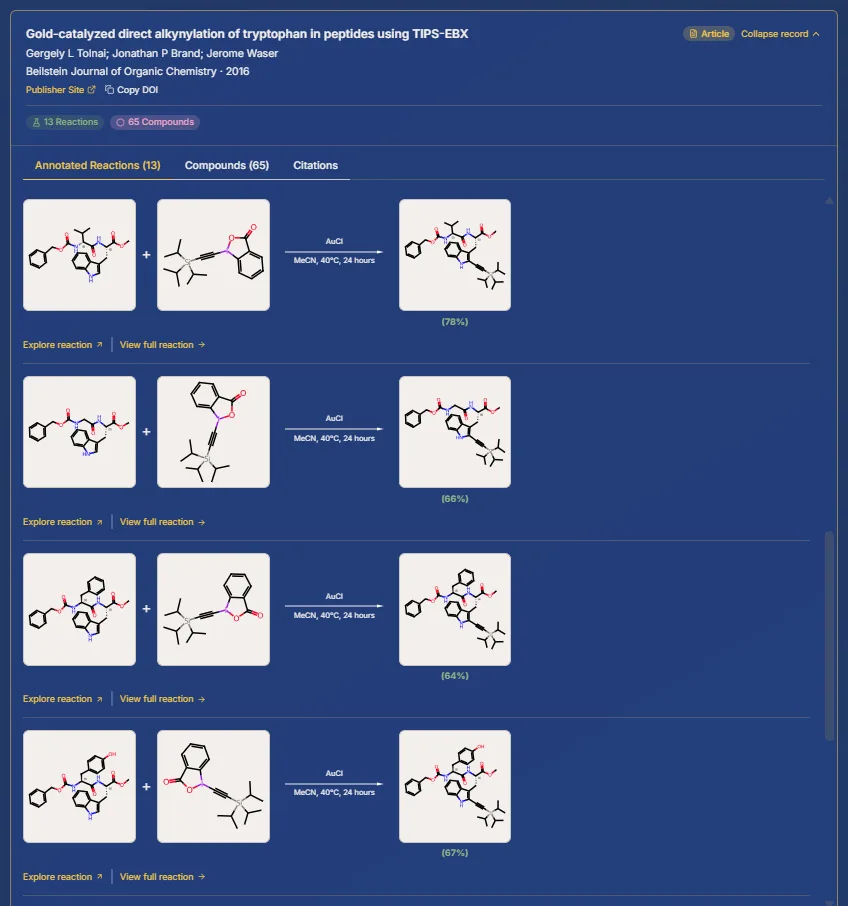
Saguaro Chem makes it easy for us to copy the reaction and molecule SMILES, and with our new drawing tool we can create a publication-quality figure that shows the general reaction and a substrate scope table showing all of the variations of that general scheme.
The new import line
With the new acacia_chem Python package, we can now import everything we need from a single package instead of from four different files:
from acacia_chem import (
    StyleConfig,
    create_layout_template,
    draw_batch,
    draw_grid,
    draw_molecule,
    draw_reaction,
)
The drawing API remains independently usable. create_layout_template is optional and records an approved coordinate reference when a scope or SAR table and a separate reaction scheme must share one orientation.
StyleConfig — one place for all drawing parameters
The DEFAULT_STYLE dict from earlier posts looked like this:
DEFAULT_STYLE = dict(
    fixedBondLength=30,
    bondLineWidth=2,
    minFontSize=14,
    maxFontSize=14,
    padding=0.08,
)
The key names are RDKit internals. StyleConfig replaces these with descriptive field names and inline comments that explain what each parameter controls:
from acacia_chem import StyleConfig

style = StyleConfig(
    bond_length=30,        # pixels between bonded atoms
    font_size=14,          # atom label point size
    padding=0.08,          # whitespace fraction around the molecule
)
Two named presets cover the most common cases:
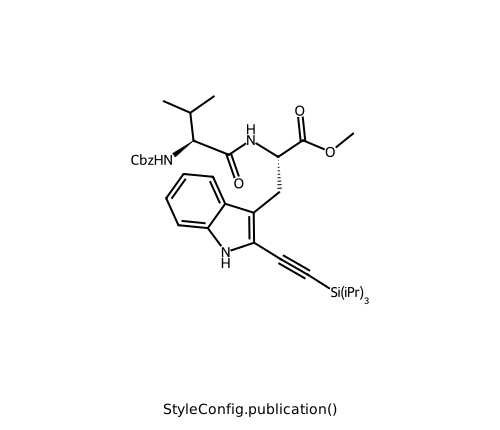
StyleConfig.publication()    # compact (30 px bonds, 14 pt) — for manuscripts
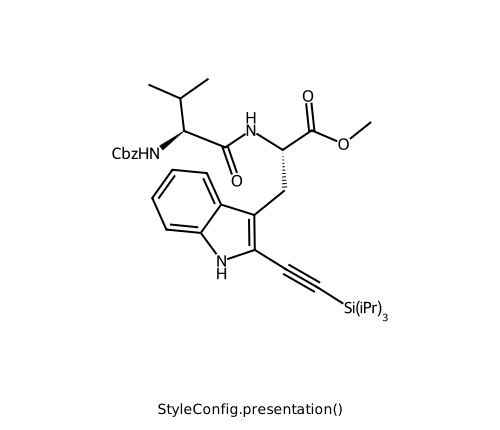
StyleConfig.presentation()   # larger (35 px bonds, 16 pt) — for slides
Here is one of the gold-catalyzed direct alkynylation products rendered with each preset:
PRODUCT_SMILES = "COC(=O)[C@H](Cc1c(C#C[Si](C(C)C)(C(C)C)C(C)C)[nH]c2ccccc12)NC(=O)[C@@H](NC(=O)OCc1ccccc1)C(C)C"
You can also pass a plain dict with RDKit key names anywhere a style argument is accepted, so code from Posts 1–3b continues to work unchanged.
Hold on! There's a problem!
Look closely at the amide C=O bonds in the two images above. See how they're skewed about 15 degrees from where the should be? This is because of an issue RDKit and CoordGen share when laying out fused ring systems: the initial orientation of the indole ring is chosen by a graph-traversal heuristic that pays no attention to the substituents attached to it. After a lot of trial and error, we found a solution that combines RDKit-native options with Indigo (EPAM's open-source cheminformatics toolkit). You can read a detailed discussion of this issue and our solution in the Technical Note on 2D Molecular Layout.
draw_molecule — one function instead of two
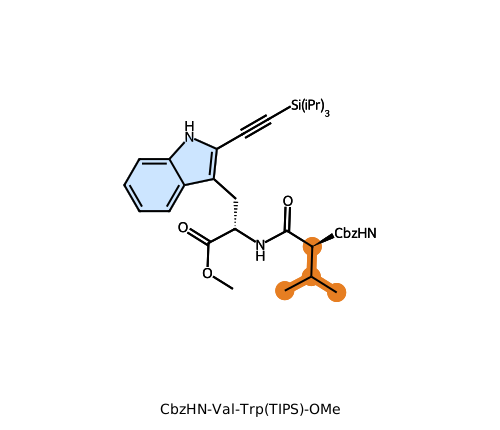
Earlier posts had draw_molecule (plain rendering) and draw_highlighted_molecule (highlighting, legends, annotations). The acacia_chem package merges them: omit highlighting arguments for a plain rendering, or add atom_colors, bond_colors, and ring_shades as shown below. Using the alkynylation product above, we highlight the valine isopropyl side chain in orange and fill the indole rings with light blue:
PRODUCT_SMILES = (
    "COC(=O)[C@H](Cc1c(C#C[Si](C(C)C)(C(C)C)C(C)C)[nH]c2ccccc12)"
    "NC(=O)[C@@H](NC(=O)OCc1ccccc1)C(C)C"
)

PRODUCT_ABBREVS = parse_abbreviations(
    "NHCbz *NC(=O)OCc1ccccc1\n"
    "Si(iPr)<sub>3</sub> *C#C[Si](C(C)C)(C(C)C)C(C)C"
)

draw_molecule(
    PRODUCT_SMILES,
    "molecule_product_highlighted.svg",
    atom_colors={30: "#e67e22", 42: "#e67e22", 43: "#e67e22", 44: "#e67e22"},
    bond_colors={
        (30, 42): "#e67e22",
        (42, 43): "#e67e22",
        (42, 44): "#e67e22",
    },
    ring_shades=[
        ([21, 22, 23, 24, 25, 26], "#cce5ff"),
        ([6, 7, 20, 21, 26], "#cce5ff"),
    ],
    abbreviations=PRODUCT_ABBREVS,
    annotation="CbzHN-Val-Trp(TIPS)-OMe",
)
draw_reaction — reaction schemes with aligned panels
draw_reaction takes a reaction SMILES, splits it into reactants and products, draws each panel, and places them around an arrow with agents above and conditions below. It uses a maximum-common-substructure alignment so the unchanged scaffold stays in the same orientation across the arrow.
from acacia_chem import draw_reaction, parse_abbreviations

REACTANT_SMILES = ( "COC(=O)[C@H](Cc1c[nH]c2ccccc12)NC(=O)" "[C@@H](NC(=O)OCc1ccccc1)C(C)C" )

PRODUCT_SMILES = ( "COC(=O)[C@H](Cc1c(C#C[Si](C(C)C)(C(C)C)C(C)C)[nH]c2ccccc12)" "NC(=O)[C@@H](NC(=O)OCc1ccccc1)C(C)C" )

PRODUCT_ABBREVS = parse_abbreviations( "CbzHN *NC(=O)OCc1ccccc1\n" "Si(iPr)<sub>3</sub> *C#C[Si](C(C)C)(C(C)C)C(C)C" )

TIPS_EBX_SMILES = "CC(C)[Si](C#CI1OC(=O)c2ccccc21)(C(C)C)C(C)C"

draw_reaction( f"{REACTANT_SMILES}>>{PRODUCT_SMILES}", "reaction_direct_alkynylation.svg", agent_text="TIPS-EBX, 5 mol % AuCl", condition_text="CH<sub>3</sub>CN, 40 °C", abbreviations=PRODUCT_ABBREVS, legend=[{"label": "TIPS-EBX", "smiles": TIPS_EBX_SMILES}], )
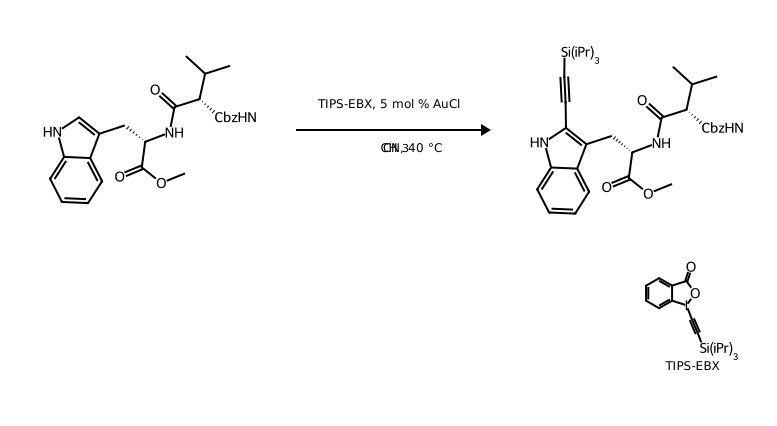
The legend argument places a smaller molecule callout in the lower-right corner. Each entry needs a "label" and a "smiles"; it can also take per-entry abbreviations and highlight_config.
Agent and condition text accept both ~sub~ / ^super^ shorthand and the HTML-style <sub> / <sup> tags used in abbreviation labels, so CH<sub>3</sub>CN renders the 3 in CH3CN as a subscript.
draw_grid — multi-panel figures
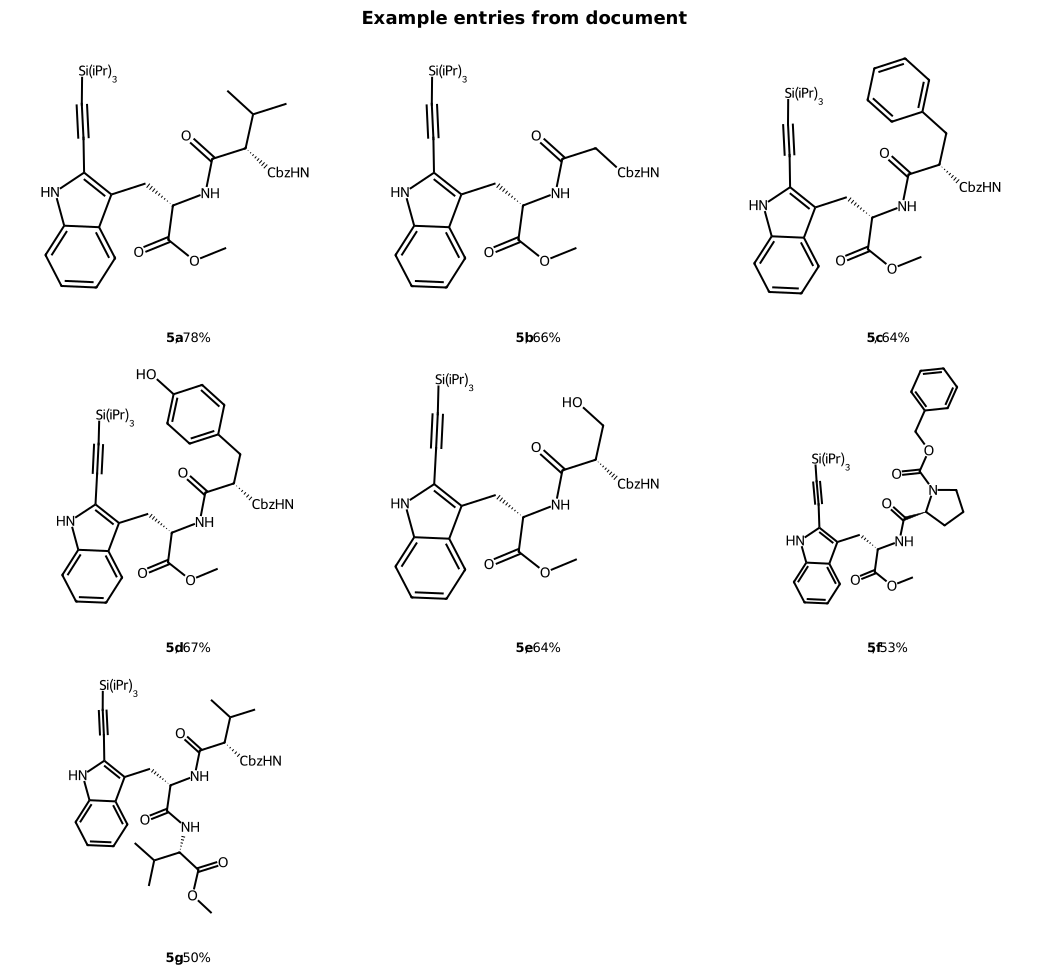
draw_grid takes a list of entry dicts and arranges them in a uniform NxM grid. Every cell uses the same bond_length from StyleConfig, so molecules are consistently scaled. This matters for SAR tables and substrate-scope tables where readers compare structures at a glance.
Here are seven example molecules taken from the substrate-scope table of our example document. When a reaction scheme and its scope table need the same author-approved scaffold orientation, use a layout template to carry one coordinate reference between them. The SMILES for the product molecules were easily copied from the Saguaro Chem Molecule Detail panels:
from acacia_chem import draw_grid

entries = [
    {"smiles": "COC(=O)[C@H](Cc1c(C#C[Si](C(C)C)(C(C)C)C(C)C)[nH]c2ccccc12)NC(=O)[C@@H](NC(=O)OCc1ccccc1)C(C)C", "label": "<b>5a</b>, 78%"},
    {"smiles": "COC(=O)[C@H](Cc1c(C#C[Si](C(C)C)(C(C)C)C(C)C)[nH]c2ccccc12)NC(=O)CNC(=O)OCc1ccccc1", "label": "<b>5b</b>, 66%"},
    {"smiles": "COC(=O)[C@H](Cc1c(C#C[Si](C(C)C)(C(C)C)C(C)C)[nH]c2ccccc12)NC(=O)[C@H](Cc1ccccc1)NC(=O)OCc1ccccc1", "label": "<b>5c</b>, 64%"},
    {"smiles": "COC(=O)[C@H](Cc1c(C#C[Si](C(C)C)(C(C)C)C(C)C)[nH]c2ccccc12)NC(=O)[C@H](Cc1ccc(O)cc1)NC(=O)OCc1ccccc1", "label": "<b>5d</b>, 67%"},
    {"smiles": "COC(=O)[C@H](Cc1c(C#C[Si](C(C)C)(C(C)C)C(C)C)[nH]c2ccccc12)NC(=O)[C@H](CO)NC(=O)OCc1ccccc1", "label": "<b>5e</b>, 64%"},
    {"smiles": "COC(=O)[C@H](Cc1c(C#C[Si](C(C)C)(C(C)C)C(C)C)[nH]c2ccccc12)NC(=O)[C@@H]1CCCN1C(=O)OCc1ccccc1", "label": "<b>5f</b>, 53%"},
    {"smiles": "COC(=O)[C@@H](NC(=O)[C@H](Cc1c(C#C[Si](C(C)C)(C(C)C)C(C)C)[nH]c2ccccc12)NC(=O)[C@@H](NC(=O)OCc1ccccc1)C(C)C)C(C)C", "label": "<b>5g</b>, 50%"},
]

SCOPE_LAYOUT_TEMPLATE = create_layout_template(
    entries[2]["smiles"],
    layout_method="indigo",
)
SCOPE_LAYOUT_TEMPLATE.save("layout_templates/indole_scope.mol")

draw_grid(
    entries,
    "grid_example_entries.svg",
    n_cols=3,
    cell_size=(350, 280),
    label_height=30,
    style={"bond_length": 35},
    abbreviations=PRODUCT_ABBREVS,
    layout_template=SCOPE_LAYOUT_TEMPLATE,
    title="Example entries from document",
)
Reusing a layout template
create_layout_template() records the reference molecule's coordinates, including the selected layout method, in a reusable LayoutTemplate. Pass that template to both draw_reaction() and draw_grid() to keep the product and table entries in the author-approved orientation; the saved .mol file is their shared coordinate source. See the 2D layout benchmark for examples that benefit from CoordGen, Indigo, or an author-approved template.
Each entry dict supports these keys:
| Key | Required | Description |
|---|---|---|
"smiles" | yes | SMILES string |
"label" | no | Caption; use\n for a second line |
"atom_colors" | no | {atom_idx: "#hex"} highlight map |
"bond_colors" | no | {(a1, a2): "#hex"} highlight map |
"atom_maps" | no | {atom_idx: int} label map |
"abbreviations" | no | Per-entry abbreviation override |
Installing locally
acacia_chem ships with a pyproject.toml so you can install it with one command:
pip install -e path/to/publication_quality_images/post_04
Both the Python API and the command-line interface are then available from any directory:
acacia-chem draw-molecule "CC(=O)Oc1ccccc1C(=O)O" aspirin.svg
acacia-chem draw-reaction "CC(=O)O.CCO>>CC(=O)OCC" ester.svg \
    --agents "H₂SO₄ (cat.)" --conditions "reflux, 2 h"
The package is not yet on PyPI — that happens in Part 6 when the API is finalized across the full series.
The CLI
draw_grid and draw_batch are intentionally Python-only. The entries list-of-dicts — with per-entry colors, atom maps, and abbreviation overrides — is too rich to flatten into command-line flags without losing functionality. For multi-panel work, a short Python script is the right tool.
Toolkit summary
| Function | What it does |
|---|---|
create_layout_template | Explicit reference SMILES → reusable coordinate-bearing template |
draw_molecule | Single molecule → SVG or PNG, optional highlights, legend, annotation |
draw_reaction | Reaction SMILES → scheme with arrow, reagent labels, and small legend panels |
draw_grid | List of entries → NxM grid with captions, consistent scaling |
draw_batch | List of entries → one file per compound |
parse_abbreviations | Text block of label/SMARTS pairs → abbreviation list |
apply_abbreviations | Mol object + abbreviation list → condensed mol |
StyleConfig | All drawing parameters in one object with named presets |
Implementation notes
A few changes under the hood make the reaction drawings in this post look the way they do:
- CoordGen is now the preferred depictor. When the package is imported it calls
rdDepictor.SetPreferCoordGen(True), so every 2D layout is generated by the Schrodinger depictor rather than the legacy RDKit one. The result is usually cleaner bond angles and less crowded carbonyls. - Product panels use
GenerateDepictionMatching2DStructure. Instead of computing product coordinates independently and then rigidly aligning them,draw_reactiongenerates the product depiction directly from the reactant reference. This keeps the shared scaffold in the same orientation while giving the new substituent more room. draw_reactionsupports alegendargument. The legend renders a small molecule panel in the lower-right corner of the scheme. It is useful for showing the structure of a common reagent (like TIPS-EBX) separately from the arrow text.- Arrow text wraps instead of stretching the arrow. Agent and condition text are measured against a maximum arrow width (
MAX_ARROW_WIDTH). If a line would come within the arrow padding, it is wrapped at word boundaries onto multiple centered lines so the scheme stays compact.
Next steps
Part 5 embeds acacia_chem output into matplotlib subplots and shows how to size figures for single-column, double-column, and full-page journal layouts.