Drawing a Single Molecule: From RDKit Default to Publication-Ready
If you're like us, you are very particular about your molecule and reaction images. For publication-quality figures, many chemists reach for ChemDraw, which is feature-rich, polished, and the de facto standard in the field. But it's also commercial software, and not every lab, workflow, or automated pipeline has a ChemDraw license sitting behind it.
RDKit, the open-source cheminformatics toolkit most of us already have installed for everything else, can produce comparable results for free, and RDKit is scriptable in a way ChemDraw never will be. The catch is that getting RDKit to produce publication-quality images takes more than a single MolToImage call.
In this six-part series, we will start with the default drawing RDKit produces and progressively build a small, reusable toolkit for publication-ready output. By the end, we will wrap that toolkit into a lightweight web demo that renders molecules and reactions from a SMILES string.
This first post focuses on the simplest case: drawing a single molecule. As our running example, we'll use a reaction pulled straight from De Novo Chem's Saguaro Chem search platform: A Pd-catalyzed silylation of 4-iodoaniline, shown below.
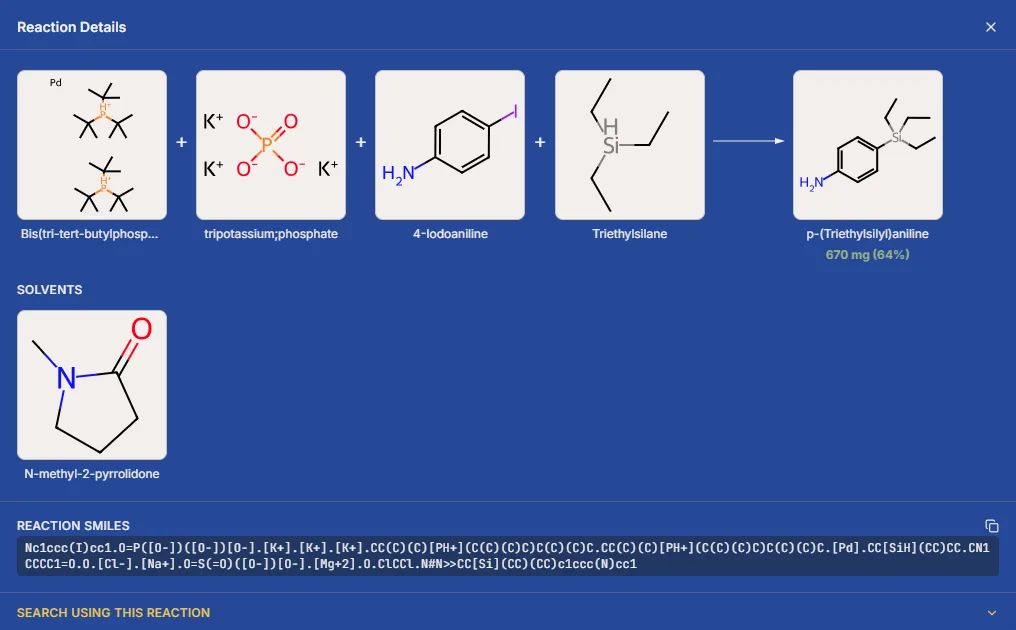
We'll come back to this reaction as a whole in Post 2, when we tackle the extra complexity that reactions bring, such as catalysts, reagents, and multiple molecules sharing one figure. For now, we'll zoom in on just one piece of it: the starting material, 4-iodoaniline, as our single-molecule example.
The default
Here's what RDKit gives you out of the box:
from rdkit import Chem
from rdkit.Chem import Draw

mol = Chem.MolFromSmiles("Nc1ccc(I)cc1")
Draw.MolToFile(mol, "4-iodoaniline_default.png", size=(400, 400))
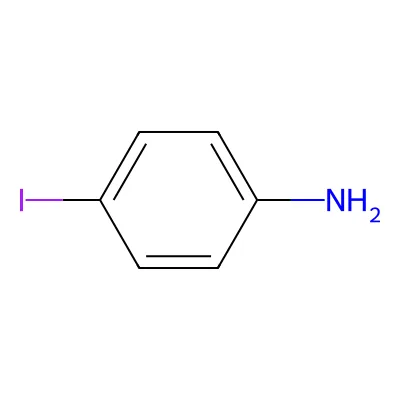
It's not wrong. But it's not something you'd want in a manuscript figure or a slide deck either. The bonds are thin and slightly uneven, the atom labels are colored in a way that reads fine on screen but looks inconsistent in print, and the molecule floats in the canvas without much sense of scale. None of these are bugs. Rather, they're just defaults tuned for "quick look," not "final figure."
We can make five small, targeted changes that will fix essentially all of it.
1. Compute 2D coordinates explicitly
RDKit will generate coordinates for you automatically if you don't explicitly compute them, but relying on that implicit step makes your figures harder to reproduce. The layout can change subtly between RDKit versions or depending on what else has touched the molecule object. Calling Compute2DCoords yourself makes coordinate generation an explicit, controllable part of your pipeline rather than something that happens to you.
from rdkit.Chem import AllChem

AllChem.Compute2DCoords(mol)
This is also the step everything downstream builds on; bond length and canvas settings only behave predictably once you know coordinates were generated on purpose, not as a side effect.
2. Set bond length and line width
Thin, uneven bonds are one of the first things that make a drawing look unpolished. A fixed bond length combined with a slightly thicker line width gives every figure a consistent, crisp feel. No more molecules that look "thin" next to ones that look "thick" depending on how RDKit happened to lay them out.
from rdkit.Chem.Draw import rdMolDraw2D

drawer = rdMolDraw2D.MolDraw2DCairo(400, 400)
opts = drawer.drawOptions()
opts.fixedBondLength = 40
opts.bondLineWidth = 2

drawer.DrawMolecule(mol)
drawer.FinishDrawing()

png = drawer.GetDrawingText()
with open("4-iodoaniline_bond_line.png", "wb") as f:
    f.write(png)
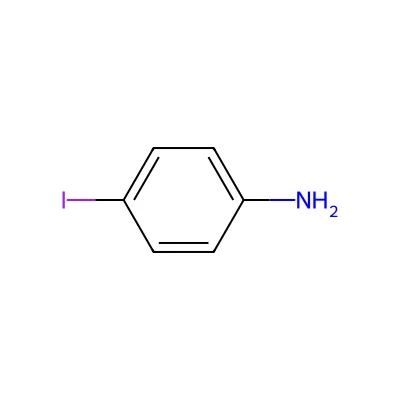
The differences are already noticeable. All the bonds read as more deliberate and less like a quick sketch.
So, what did we do?
-
We switched to the Cairo drawing backend. RDKit can render molecules through several backends; Cairo is the one that produces PNG images. In practice, you can think of it as RDKit's "bitmap renderer." The line
rdMolDraw2D.MolDraw2DCairo(400, 400)creates a 400 × 400 pixel canvas and hands it to RDKit. If you wanted an SVG instead, you would useMolDraw2DSVGwith the same calls; the API is identical, only the output format changes. -
We set the drawing options before drawing. The
drawOptions()object is where you configure the appearance of the figure. We set two values before callingDrawMolecule:fixedBondLength = 40tells RDKit to draw every bond at the same length, in drawing units. This is what makes the figure look consistent rather than letting RDKit resize bonds to fit the canvas.bondLineWidth = 2thickens the bonds. The default is thinner, which can look washed out in print or at low resolution.
The important detail is that these options must be set before
DrawMoleculeandFinishDrawing. RDKit finalizes the rendering onceFinishDrawing()is called, so changing options afterward has no effect. -
We wrote the rendered bytes to a file.
GetDrawingText()returns the finished PNG as raw binary data, so we open the file in binary mode ("wb") and write those bytes. The resulting4-iodoaniline_bond_line.pngis a standard PNG that can go directly into a manuscript, a slide, or this post.
This pattern create drawer, set options, draw, finish, save is the basic loop for every RDKit image we will generate in this series.
Seeing the effect of bond width
To make the effect concrete, here is the same molecule rendered with three different bond line widths. Each image is produced by the same pattern; only bondLineWidth changes.
for width in [1, 2, 4]:
    drawer = rdMolDraw2D.MolDraw2DCairo(400, 400)
    opts = drawer.drawOptions()
    opts.fixedBondLength = 40
    opts.bondLineWidth = width

    drawer.DrawMolecule(mol)
    drawer.FinishDrawing()

    png = drawer.GetDrawingText()
    with open(f"4-iodoaniline_width_{width}.png", "wb") as f:
        f.write(png)
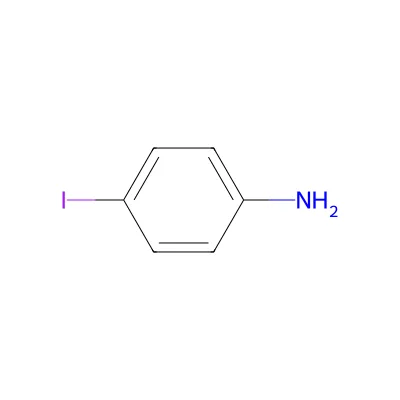 bondLineWidth = 1
|
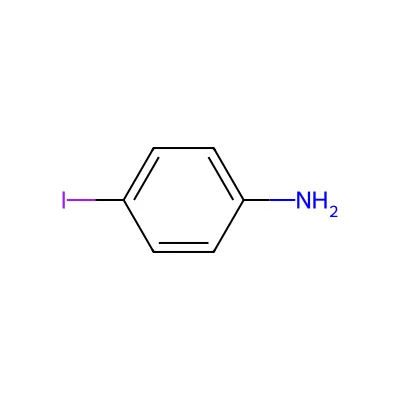 bondLineWidth = 2
|
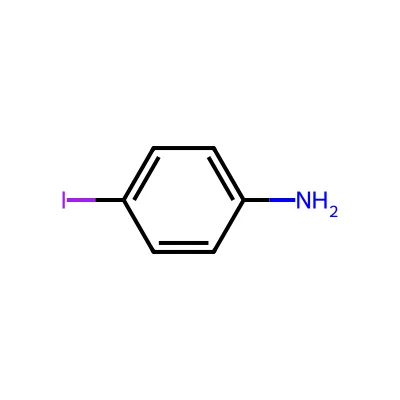 bondLineWidth = 4
|
A width of 1 (left) is close to the RDKit default and looks thin in print. 2 (center) is a safe starting point for most figures. 4 (right) is useful if you need the molecule to remain legible at a very small size, such as a thumbnail or an inset panel. For the rest of this series we will use 2 as the baseline.
3. Choose a readable font size
Default atom labels can be too small relative to the bond length (hard to read at print resolution) or too large (crowding the bonds). Since we've already fixed the bond length, we can pick a font size that's legible against it and hold it fixed across every figure we generate. That consistency matters more than any single "correct" size.
opts.minFontSize = 18
opts.maxFontSize = 18
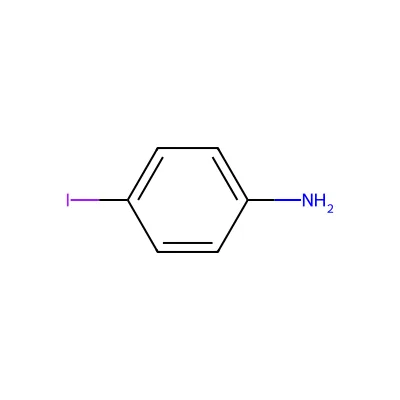
4. Use a consistent atom color palette
RDKit's default palette with colored heteroatoms is perfectly readable on screen, but for print or PDF output most chemists reach for black-on-white instead, often called ACS 1996 style. It's the convention most journals expect, and it holds up far better than colored atoms when a figure gets printed, photocopied, or dropped into a black-and-white PDF.
opts.useBWAtomPalette()
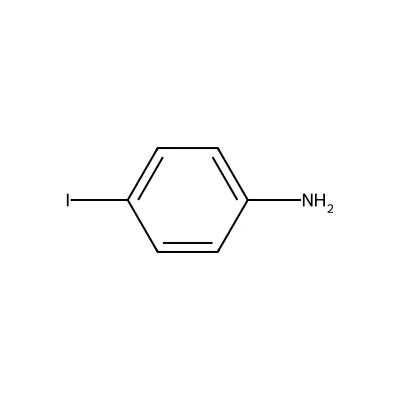
5. Control the canvas and margins
The last piece is making sure the molecule actually fills the space it's given. We don't want to see it crammed into a corner or floating in a sea of white like the images above. With a fixed canvas like MolDraw2DCairo(400, 400), RDKit will scale the molecule to fit the box, so changing padding often has little visible effect because the scaling algorithm is already trying to maximize the structure.
A better way to control the canvas is to use RDKit's "flexicanvas" mode, described in Greg Landrum's post on drawing options explained. If instead of using MolDraw2DCairo(400, 400) you pass (-1, -1) as the canvas size, RDKit measures the molecule and creates a canvas that is just large enough to hold it, with the margin controlled by padding.
drawer = rdMolDraw2D.MolDraw2DCairo(-1, -1)
opts = drawer.drawOptions()
opts.fixedBondLength = 40
opts.bondLineWidth = 2
opts.minFontSize = 18
opts.maxFontSize = 18
opts.useBWAtomPalette()
opts.padding = 0.05
Here is the same molecule rendered with three different padding values in flexicanvas mode:
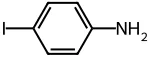 padding = 0.05
|
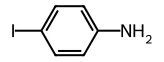 padding = 0.10
|
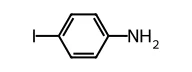 padding = 0.20
|
As padding increases from 0.05 to 0.10 to 0.20, the canvas grows but the molecule is still drawn at the same bond length. The structure therefore occupies a smaller fraction of the image, and the gap between the bond terminus and the atom label appears to shrink relative to the overall canvas. Beyond about 0.10, the extra whitespace begins to dominate the figure and the molecule starts to look like a small island in a large canvas. For most publication figures, this is undesirable: the structure should be the dominant visual element, not the margin. We recommend keeping padding at or below 0.10 unless you deliberately need extra space for annotations or legends.
If you absolutely need a fixed output size because a journal template requires it, the best approach is to render with flexicanvas and then scale or crop the resulting image, or render to a larger fixed canvas and trim the whitespace afterward.
Putting it together
One more decision before we call this done: PNG or SVG? For anything headed to a manuscript, a slide deck, or a designer, SVG is usually the better choice because it's a vector format, so it scales to any size without pixelating, and the paths stay editable in something like Illustrator or Inkscape afterward. PNG is still handy for quick previews or anywhere a raster is simpler to drop in, like a Slack message or a README.
RDKit supports both through the same rdMolDraw2D interface by usingMolDraw2DCairo for PNG or MolDraw2DSVG for SVG, so it costs almost nothing to support both and let the caller decide:
import argparse
from rdkit import Chem
from rdkit.Chem import AllChem
from rdkit.Chem.Draw import rdMolDraw2D


def draw_molecule(
    smiles: str,
    path: str,
    size: tuple[int, int] | None = (400, 400),
    fmt: str = "png",
) -> None:
    mol = Chem.MolFromSmiles(smiles)
    AllChem.Compute2DCoords(mol)

    canvas_size = size if size is not None else (-1, -1)
    drawer = (
        rdMolDraw2D.MolDraw2DSVG(*canvas_size)
        if fmt == "svg"
        else rdMolDraw2D.MolDraw2DCairo(*canvas_size)
    )

    opts = drawer.drawOptions()
    opts.fixedBondLength = 40
    opts.bondLineWidth = 2
    opts.minFontSize = 18
    opts.maxFontSize = 18
    opts.useBWAtomPalette()
    opts.padding = 0.1

    rdMolDraw2D.PrepareAndDrawMolecule(drawer, mol)
    drawer.FinishDrawing()

    mode = "w" if fmt == "svg" else "wb"
    with open(path, mode) as f:
        f.write(drawer.GetDrawingText())


if __name__ == "__main__":
    parser = argparse.ArgumentParser(description="Draw a publication-ready molecule image.")
    parser.add_argument("smiles", help="SMILES string for the molecule")
    parser.add_argument("output", help="Output file path, e.g. molecule.svg or molecule.png")
    parser.add_argument(
        "--format", choices=["png", "svg"], default=None,
        help="Output format. Inferred from the output filename if not given.",
    )
    parser.add_argument(
        "--flexicanvas",
        action="store_true",
        help="Let RDKit choose the canvas size based on the molecule and padding.",
    )
    args = parser.parse_args()

    fmt = args.format or ("svg" if args.output.lower().endswith(".svg") else "png")
    size = None if args.flexicanvas else (400, 400)
    draw_molecule(args.smiles, args.output, size=size, fmt=fmt)
python draw_molecule.py "Nc1ccc(I)cc1" 4-iodoaniline_all_opts.png --flexicanvas
python draw_molecule.py "Nc1ccc(I)cc1" 4-iodoaniline_all_opts.svg --flexicanvas
The format is inferred from the file extension, so you only need --format if you want to override it. The --flexicanvas flag tells RDKit to size the canvas to the molecule rather than forcing a fixed 400 × 400 output. One small caveat: MolDraw2DCairo relies on the cairo backend RDKit ships with, which should already be present in a standard pip install rdkit. That's worth knowing about if you ever hit an unexpected import error on an unusual build.
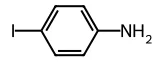 PNG output
|
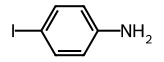 SVG output
|
If you look closely at these two figures, the PNG will look softer or pixelated while the SVG stays crisp. That is the difference between the two formats in practice: the PNG is a fixed grid of pixels, so enlarging it reveals the individual dots, whereas the SVG stores the drawing as paths and text that render cleanly at any size. For manuscripts, slides, or any figure that might be resized, the SVG is the safer choice.
Look at the difference between the initial and final versions! Same molecule, same SMILES string, dramatically different figure as compared to where we started. None of these changes require anything beyond rdMolDraw2D's built-in options. There's no custom rendering and no post-processing in another tool. That's the point of this series: RDKit already has what you need, it's just not the default.
Next up: in Post 2, we'll take this same draw_molecule approach and extend it to reactions starting with the Pd-catalyzed silylation of 4-iodoaniline, and the specific ways RDKit's default reaction drawing falls apart once a catalyst and reagents enter the picture.