Drawing Reactions: Highlighting and Annotating Molecules in RDKit
Highlighting and Annotating Molecules in RDKit
In the first two posts we built a small, reusable drawing toolkit: a base renderer for single molecules, then a composer that assembles those molecules into reaction schemes. The drawings already look clean, with fixed bond lengths, consistent fonts, and a black-and-white atom palette. But a publication or presentation figure often needs to do more than just display a structure. It needs to emphasize something: a matched substructure, a stereocenter, a ring, or a set of mapped atoms.
This post extends the toolkit with three kinds of visual emphasis for single molecules:
- Abbreviations: condense common fragments (
Boc,PhOH,tBu, etc.) into compact labels. - Atom and bond highlighting: color specific atoms and bonds directly on the structure.
- Atom-mapping numbers, legends, and annotations: add explanatory labels without cluttering the drawing.
A companion post, Part 3b: Highlighting and Mapping Reactions, applies the same ideas to reaction schemes.
As our example we will use a protected dipeptide, Boc-Trp-Tyr-OMe, that is well suited for illustrating all three kinds of emphasis. We found a our example compound using Saguaro Chem Search.
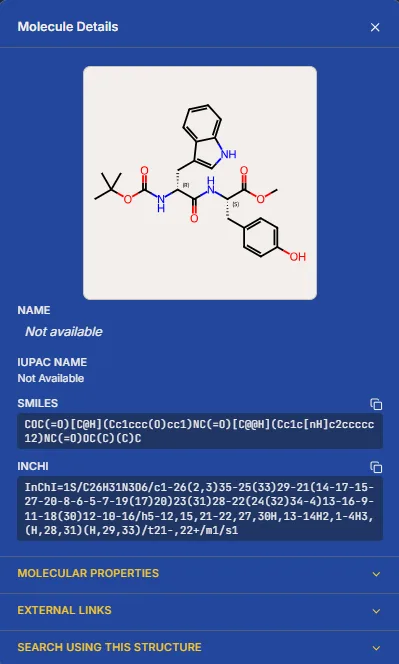
Saguaro Chem lets you copy the SMILES directly, which is reproduced below:
COC(=O)[C@H](Cc1ccc(O)cc1)NC(=O)[C@@H](Cc1c[nH]c2ccccc12)NC(=O)OC(C)(C)C
It contains a Boc protecting group, a tyrosine residue with a free phenol, a tryptophan residue with an indole ring, three carbonyls (ester, amide, carbamate), and two explicit stereocenters. This is exactly the kind of structure where abbreviation and selective highlighting make a figure more readable.
The helper functions used below are included in the Appendix of Part 3b: Highlighting and Mapping Reactions. Copy them into a single script before running the examples.
Drawing the molecule
We start from the same draw_molecule helper we carried over from Post 2:
SMILES = "COC(=O)[C@H](Cc1ccc(O)cc1)NC(=O)[C@@H](Cc1c[nH]c2ccccc12)NC(=O)OC(C)(C)C"

draw_molecule(SMILES, "molecule_baseline.png", size=(500, 400))
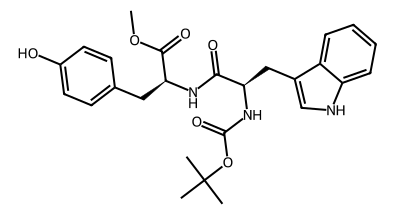
The drawing is already publication-ready in the sense of bond lengths, line widths, and palette, but the molecule itself is dense. The Boc group and the indole ring both take up space, and it is often the case that we want to draw our readers' attention to a specific part of a molecule, such as a functional group or a reacting center.
Abbreviations: what RDKit's rdAbbreviations does
RDKit ships with an abbreviation engine in rdkit.Chem.rdAbbreviations. The idea is simple: you define a fragment as a SMARTS pattern and a label, and RDKit replaces any matching fragment with a single atom that displays the label.
How it works
Each abbreviation is defined by two things:
- A label, such as
NHBocorHOPh. - A SMARTS pattern, such as
*NC(=O)OC(C)(C)Cfor NHBoc or*c1ccc(O)cc1for a 4-hydroxyphenyl group.
The * atom is the attachment point: it represents the atom in the parent molecule that is bonded to the fragment you want to abbreviate. For NHBoc *NC(=O)OC(C)(C)C:
*= the alpha carbon attached to the NHBoc nitrogen.N= the carbamate nitrogen (the NH).C(=O)O= the carbamate carbonyl and oxygen.C(C)(C)C= the tert-butyl group.
When RDKit finds this pattern in the molecule, it replaces the NH and the entire Boc fragment with a single atom labeled NHBoc. This is the standard chemist's convention; the label appears directly on the carbon and no explicit bond to a floating Boc atom is drawn. The same logic applies to HOPh *c1ccc(O)cc1, which collapses the tyrosine 4-hydroxyphenyl ring to a label on the benzylic CH₂. Note that the label is written HOPh rather than PhOH: RDKit renders the string exactly as written, so the label must be authored with the correct outward-reading orientation. The hydroxyl end faces away from the bond, so HO-Ph reads correctly left-to-right as HOPh.
RDKit provides a default list via rdAbbreviations.GetDefaultAbbreviations(), but for a publication figure you usually want a curated list. We use this default set:
from rdkit import Chem
from rdkit.Chem import rdAbbreviations

DEFAULT_ABBREVIATIONS = """
Ac *C(=O)C
Allyl *CC=C
Bn *Cc1ccccc1
Boc *C(=O)OC(C)(C)C
Bz *C(=O)c1ccccc1
Cbz *C(=O)OCc1ccccc1
CF3 *C(F)(F)F
CHO *C=O
CO2Et *C(=O)OCC
COOH *C(=O)O
Cp *c1cccc1
DMS *S(C)C
DMSO *S(=O)(C)C
Et *CC
Fmoc *C(=O)OCC1c2ccccc2-c3ccccc31
iPr *C(C)C
Me *C
Ms *S(=O)(=O)C
NMe *NC
NO2 *N(=O)=O
OMe *OC
OEt *OCC
Ph *c1ccccc1
tBu *C(C)(C)C
Tf *S(=O)(=O)C(F)(F)F
TFA *C(=O)C(F)(F)F
THF *C1CCOC1
Ts *S(=O)(=O)c1ccc(C)cc1
"""


def parse_abbreviations(text: str):
    return rdAbbreviations.ParseAbbreviations(text)


def apply_abbreviations(mol: Chem.Mol, abbrev_defs, max_coverage: float = 0.4):
    mol_copy = Chem.Mol(mol)
    return rdAbbreviations.CondenseMolAbbreviations(
        mol_copy, abbrev_defs, maxCoverage=max_coverage
    )
The most important detail is maxCoverage. RDKit's default is 0.4, which means a single abbreviation is only applied if it covers no more than 40% of the molecule's heavy atoms. This prevents over-abbreviation: you would not want RDKit to replace most of a small molecule with one label. For very small molecules you can raise this to 1.0; for our example 0.4 works fine.
Applying abbreviations to the drawing
We pass the parsed abbreviation definitions into draw_molecule:
abbrevs = parse_abbreviations(DEFAULT_ABBREVIATIONS)

draw_molecule(
    SMILES,
    "molecule_abbreviated.png",
    size=(500, 400),
    abbreviations=abbrevs,
)
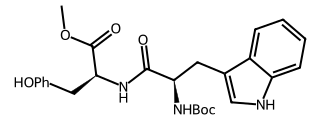
The NH and the entire Boc group collapse to NHBoc on the Trp alpha carbon, and the tyrosine 4-hydroxyphenyl ring collapses to HOPh on the benzylic CH₂. Both patterns are unique, so there is no ordering ambiguity; each matches exactly one fragment.
Customizing a label
The label in each label SMARTS line is arbitrary text. If your field prefers NHCbz instead of NHBoc, simply write a new line with the appropriate SMARTS:
DEFAULT_ABBREVIATIONS = """
...
NHBoc *NC(=O)OC(C)(C)C
NHCbz *NC(=O)OCc1ccccc1
HOPh *c1ccc(O)cc1
...
"""
You can also pass a custom list for a single drawing without editing the default file:
custom_abbrevs = parse_abbreviations("""
NHBoc *NC(=O)OC(C)(C)C
HOPh *c1ccc(O)cc1
""")

draw_molecule(SMILES, "with_custom.png", size=(500, 400), abbreviations=custom_abbrevs)
If you include both NHBoc *NC(=O)OC(C)(C)C and tBu *C(C)(C)C, the resulting image will depend on the order they appear in the definition string. RDKit applies abbreviations sequentially; whichever pattern is listed first gets to match first. If tBu comes first, it consumes the tert-butyl group before NHBoc can match the full carbamate fragment, so NHBoc is silently skipped. If NHBoc comes first, it matches the whole group and tBu finds nothing left. This means that you should always list the more specific (larger) pattern before any of its substructures.
The same fragment in different orientations
RDKit renders abbreviation labels exactly as written at the anchor atom. This becomes awkward when the same fragment appears more than once in a single molecule in orientations where the same label would read backwards for one of them. For example, a molecule may contain two ethoxy groups, one drawn with the oxygen on the left and one with the oxygen on the right. A label OEt reads naturally for the first but may look reversed for the second.
RDKit solves this by allowing each abbreviation to carry a second display label, displayLabelW, used when the group is drawn in the wide/flipped orientation. The line format is:
label SMARTS displayLabel displayLabelW
For an ethoxy group we can provide both OEt and EtO as display labels:
mixed_abbrevs = parse_abbreviations("OEt *OCC  OEt  EtO")

draw_molecule(
    "c1c(OCC)cc(OCC)cc(OCC)1",
    "molecule_mixed_labels.svg",
    size=(500, 400),
    abbreviations=mixed_abbrevs,
)
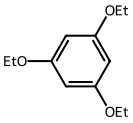
RDKit chooses between displayLabel (OEt) and displayLabelW (EtO) based on how much horizontal space the group occupies in the drawing. The same SMARTS pattern (*OCC) matches every ethoxy group; only the rendered text changes. This is different from the per-side abbreviation sets in Part 3b, where the same moiety needs a fixed different label on the reactant and product sides because the two sides are rendered as separate panels.
R-group abbreviations
You can use the same mechanism to collapse any fragment to an R-group label. Write the fragment SMARTS with * as the attachment point and give it whatever label you like (R, R1, PG, LG, etc.). This is useful in SAR tables or when you want to focus a figure on one part of a molecule without drawing the rest in full.
Two practical caveats:
- Coverage limit. RDKit's
CondenseMolAbbreviationsskips any abbreviation that would cover more thanmaxCoverageof the molecule's heavy atoms (default 40%). A large R-group fragment may exceed this threshold and silently fail to abbreviate. You can raise the limit by passing a higher value toapply_abbreviations. - Every occurrence is collapsed. If the same fragment appears twice, both are replaced. There is no way to abbreviate only one of two identical groups.
Here we collapse the tryptophan indolylmethyl side chain (Cc1c[nH]c2ccccc12) to R, while also applying the NHBoc abbreviation. The indole fragment is 11 of 35 heavy atoms (31%), well within the default 0.4 coverage limit, so no override is needed:
from rdkit import Chem
from rdkit.Chem import AllChem

r_group_abbrevs = parse_abbreviations("R *Cc1c[nH]c2ccccc12\nNHBoc *NC(=O)OC(C)(C)C")
r_mol = Chem.MolFromSmiles(SMILES)
AllChem.Compute2DCoords(r_mol)
r_mol_abbrev = apply_abbreviations(r_mol, r_group_abbrevs)
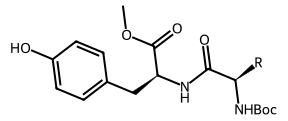
The indolylmethyl side chain is replaced by R at the benzylic carbon, and the carbamate nitrogen is labeled NHBoc, leaving only the dipeptide backbone and the tyrosine side chain drawn in full.
A few practical notes:
- Abbreviations are applied before rendering, so they affect atom indices. If you later want to highlight specific atoms, you must work from the condensed molecule or avoid combining highlights and abbreviations on the same call.
- The abbreviation engine is pattern-based: a given SMARTS matches every occurrence of that fragment. You cannot selectively abbreviate one benzyl group and leave another benzyl drawn, even if they are in different chemical environments, because
CondenseMolAbbreviationsdoes not honor query constraints on the attachment-point atom. If two groups are different enough to match different patterns (for example, one isBnand the other isPh), you can include only the pattern you want; otherwise you must abbreviate all matching groups or none. - The input molecule is copied inside
apply_abbreviations, so the originalmolobject is unchanged. - You can mix built-in and custom abbreviations. Start with the defaults and add project-specific labels as needed.
Atom and bond highlighting
Abbreviations reduce clutter. Highlighting adds emphasis. RDKit can highlight individual atoms and bonds, which is useful for calling out functional groups, reaction centers, matched substructures, or any set of atoms you want the reader to notice.
One clarification before we begin: in RDKit, the only built-in way to give a specific atom or bond a custom color is the highlight mechanism. You can change the global atom-symbol color or set an element-wide palette, but you cannot recolor one atom label or one bond line independently without using highlightAtoms/highlightBonds and a color map. Everything below is therefore about configuring highlights, not about changing the intrinsic color of the underlying drawing.
In this section we will walk through every highlighting option RDKit gives us, from the simplest default highlight to fine-grained control over colors, halo sizes, and bond widths.
What RDKit lets you control
The relevant entry point is rdMolDraw2D.PrepareAndDrawMolecule. Its signature includes these highlighting arguments:
highlightAtoms: a list of atom indices to highlight.highlightBonds: a list of bond indices to highlight.highlightAtomColors: a dictionary mapping each highlighted atom index to an(r, g, b)color tuple.highlightBondColors: a dictionary mapping each highlighted bond index to an(r, g, b)color tuple.highlightAtomRadii: a dictionary mapping each highlighted atom index to a custom halo radius.legend: a small caption string drawn above the molecule.kekulize: whether to render aromatic rings in Kekulé form (defaultTrue).
In addition, the drawOptions() object on the drawer controls the style of the highlight:
highlightRadius: the default radius of the colored disk behind each highlighted atom.fillHighlights: whether the disk is filled or only outlined.highlightBondWidthMultiplier: how much thicker a highlighted bond is drawn compared to a normal bond.
Together these give you complete control over which atoms and bonds are emphasized, what color they are, and how visually heavy the emphasis is.
A minimal atom highlight
The simplest possible highlight is just a list of atom indices:
draw_highlighted_molecule(
    SMILES,
    "molecule_minimal_highlight.png",
    size=(500, 400),
    highlight_atoms=[4, 16],
)
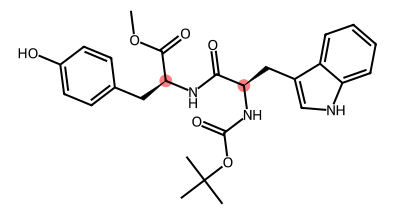
RDKit draws a light red disk behind each of those atoms. This is useful for quick emphasis, but in a publication figure you almost always want to control the color, so the highlight matches a legend or a color scheme.
Finding atom indices
Every atom in an RDKit molecule has a zero-based index. You can list them directly:
mol = Chem.MolFromSmiles(SMILES)
for atom in mol.GetAtoms():
    print(atom.GetIdx(), atom.GetSymbol())
For our example SMILES the output looks like this when drawn with addAtomIndices = True:
style = {"addAtomIndices": True}
draw_molecule(SMILES, "molecule_atom_indices.png", size=(600, 450), style=style)
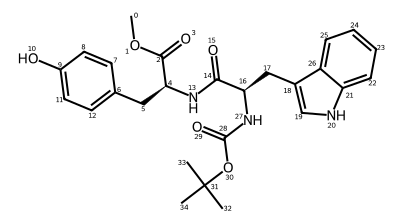
For functional groups and rings, it is usually better to let RDKit find the indices for you so the code does not break if the SMILES changes:
# All atoms in a carbonyl group
patt = Chem.MolFromSmarts("C(=O)")
carbonyl_atoms = set()
for match in mol.GetSubstructMatches(patt):
    carbonyl_atoms.update(match)

# All ring atoms
ring_atoms = set()
for ring in mol.GetRingInfo().AtomRings():
    ring_atoms.update(ring)

# Explicit stereocenters only
chiral_atoms = {idx for idx, _ in Chem.FindMolChiralCenters(mol, includeUnassigned=False)}
For our example molecule these sets are:
carbonyl_atoms: {2, 3, 14, 15, 28, 29}
ring_atoms: {6, 7, 8, 9, 10, 11, 12, 18, 19, 20, 21, 22, 23, 24, 25, 26}
chiral_atoms: {4, 16}
The rest of this section uses a mix of SMARTS queries and known indices so you can see both approaches.
Adding per-atom colors
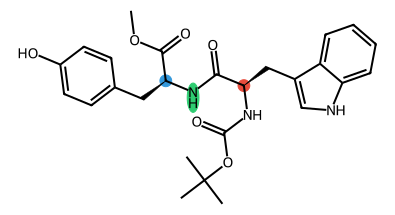
To choose your own colors, pass highlightAtomColors as a dictionary keyed by atom index:
rdMolDraw2D.PrepareAndDrawMolecule(
    drawer,
    mol,
    highlightAtoms=[14, 15, 16],
    highlightAtomColors={
        14: (0.2, 0.6, 0.9),   # blue
        15: (0.9, 0.3, 0.2),   # red
        16: (0.2, 0.8, 0.4),   # green
    },
)
The color values are RGB tuples scaled to [0, 1], which is the format RDKit expects. Two things to remember:
- Every atom in
highlightAtomsmust also have an entry inhighlightAtomColorsif you want a custom color. If an atom is listed but has no color, RDKit falls back to its default blue. - The reverse is also true: atoms in
highlightAtomColorsbut not inhighlightAtomsare not highlighted.
Highlighting bonds
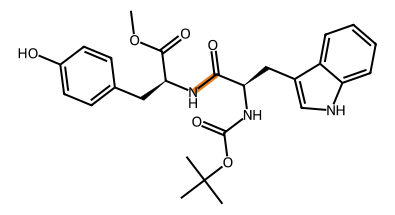
Bond highlighting follows the same pattern, but the dictionary keys are bond indices, not atom indices. If you know the two atoms a bond connects, you can look up the bond index with mol.GetBondBetweenAtoms:
bond = mol.GetBondBetweenAtoms(14, 15)
bond_idx = bond.GetIdx()

rdMolDraw2D.PrepareAndDrawMolecule(
    drawer,
    mol,
    highlightBonds=[bond_idx],
    highlightBondColors={bond_idx: (0.2, 0.8, 0.4)},
)
You can combine atom and bond highlights in the same call. That is what we do in the full example later in this section.
Controlling the atom halo
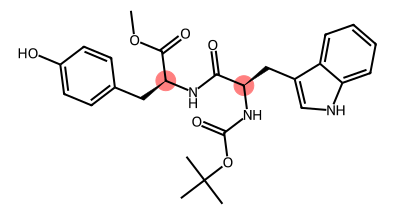
By default RDKit draws each highlighted atom as a filled disk. The size of the disk is controlled by highlightRadius in the draw options:
opts = drawer.drawOptions()
opts.highlightRadius = 0.3
The default is a good compromise for most molecules. Increase it if your figure is large and sparse; decrease it if the disks overlap neighboring atoms in a crowded structure.
If you need different radii for different atoms, use the highlightAtomRadii argument to PrepareAndDrawMolecule instead. This overrides the global radius on a per-atom basis.
Outline vs. filled highlights
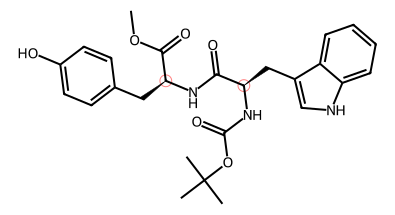
The fillHighlights option controls whether the halo is a solid disk or just a ring:
opts = drawer.drawOptions()
opts.fillHighlights = False
Filled highlights are usually easier to read, especially when several highlighted atoms are close together. Outline-only highlights can work well if you want a more subtle effect or if the fill is obscuring bond lines.
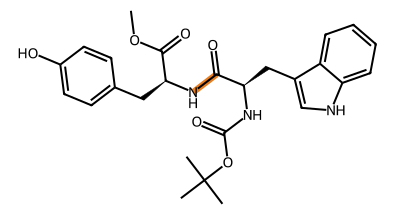
Controlling highlighted bond width
When a bond is highlighted, RDKit draws it wider than a normal bond. The amount of extra width is controlled by highlightBondWidthMultiplier:
opts = drawer.drawOptions()
opts.highlightBondWidthMultiplier = 2.0
A value of 2.0 makes highlighted bonds twice as thick as normal bonds. We keep this at the default for our figures; it is enough to be visible without making the drawing look cartoonish.
Shading ring interiors
RDKit does not have a built-in option to fill the interior of a ring, but you can achieve the effect with a two-pass drawing trick. Greg Landrum describes the idea in the RDKit blog post "Highlight atoms in drawings":
- Draw the molecule once so RDKit finalizes atom positions and canvas scale.
- Clear the canvas.
- Use the 2D conformer positions to draw filled polygons for the rings you want to shade.
- Set
clearBackground = Falseand draw the molecule again on top of the shaded polygons.
The draw_highlighted_molecule helper in highlight.py automates this when you pass ring_shades. Each entry is a tuple of (atom_indices, color). For example, to shade the indole pyrrole ring in our example molecule light green:
draw_highlighted_molecule(
    SMILES,
    "molecule_ring_shaded.png",
    size=(500, 400),
    ring_shades=[([19, 18, 26, 21, 20], "#b2ffb2")],
)
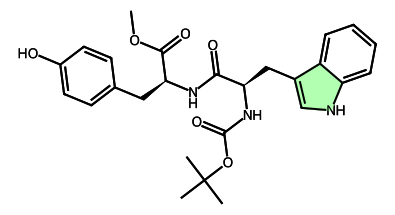
This is useful when you want to emphasize an entire ring system rather than individual atoms or bonds. The shading sits behind the bond lines because the molecule is redrawn on top, so the figure remains readable.
A helper that hides the bookkeeping
These options are powerful, but using them directly requires a lot of bookkeeping. You have to convert hex colors to RGB, look up bond indices, and keep highlightAtoms and highlightAtomColors in sync. The draw_highlighted_molecule helper wraps all of this:
atom_colors = {
    2: "#e74c3c",
    3: "#e74c3c",
    14: "#e74c3c",
    15: "#e74c3c",
    28: "#e74c3c",
    29: "#e74c3c",
}

bond_colors = {
    (4, 2): "#2ecc71",
    (4, 5): "#2ecc71",
    (4, 13): "#2ecc71",
}

draw_highlighted_molecule(
    SMILES,
    "molecule_highlighted.png",
    size=(500, 400),
    atom_colors=atom_colors,
    bond_colors=bond_colors,
)
You provide dictionaries keyed by atom index and by (atom1, atom2) pairs; the function converts them to the format RDKit expects. If you supply atom_colors, the function automatically derives highlightAtoms from the keys, so you do not have to list the same indices twice.
Selecting atoms with SMARTS
Hard-coding atom indices is fragile. A better approach is to let SMARTS find the atoms for you. We already parsed the molecule at the top of the script, so we can reuse it:
from rdkit import Chem

mol = Chem.MolFromSmiles(SMILES)

carbonyl_atoms = set()
patt = Chem.MolFromSmarts("C(=O)")
for match in mol.GetSubstructMatches(patt):
    carbonyl_atoms.update(match)

chiral_atoms = {idx for idx, _ in Chem.FindMolChiralCenters(mol, includeUnassigned=False)}

atom_colors = {}
for idx in carbonyl_atoms:
    atom_colors[idx] = "#e74c3c"
for idx in chiral_atoms:
    atom_colors[idx] = "#3498db"

bond_colors = {
    (4, 2): "#2ecc71",
    (4, 5): "#2ecc71",
    (4, 13): "#2ecc71",
}

draw_highlighted_molecule(
    SMILES,
    "molecule_highlighted.png",
    size=(500, 400),
    atom_colors=atom_colors,
    bond_colors=bond_colors,
    legend={
        "#e74c3c": "carbonyl functional groups",
        "#3498db": "stereocenters",
        "#2ecc71": "bonds to selected stereocenter",
    },
)
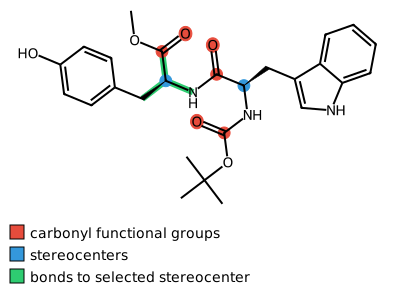
SMARTS matching is useful for functional groups: the C(=O) pattern finds all carbonyls without hard-coding indices. For stereocenters we use Chem.FindMolChiralCenters with includeUnassigned=False, which returns only the atoms that are actually marked as chiral in the input. This avoids highlighting adjacent ring or bridgehead atoms that RDKit considers potentially stereogenic but which are not part of the stereochemical intent of the drawing.
Using patterns instead of raw indices has two advantages:
- Robustness. If the SMILES changes slightly, the pattern usually still finds the right atoms.
- Semantics. The code documents intent: "highlight all carbonyls" rather than "highlight atoms 2, 14, 28, ...".
For bond highlights there is no universal SMARTS shortcut, so those are still selected by atom pair. In practice we pick the bonds around a specific atom of interest. Here, we've selected the three bonds adjacent to the selected stereocenter at atom 4 (the Tyr residue).
Combining highlights, ring shading, and abbreviations
The helper lets you stack all of these effects in a single call. Below is the same carbonyl/stereocenter highlight as above, but the NHBoc and HOPh groups are abbreviated and the indole pyrrole ring is shaded light green:
draw_highlighted_molecule(
    SMILES,
    "molecule_highlighted_abbreviated.png",
    size=(500, 400),
    atom_colors=atom_colors,
    bond_colors=bond_colors,
    ring_shades=[([12, 13, 14, 15, 20], "#b2ffb2")],
    legend=legend,
    abbreviations=abbrevs,
)
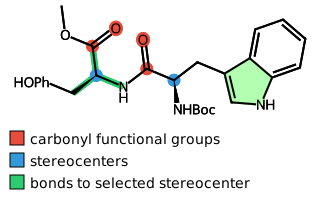
Because draw_highlighted_molecule applies abbreviations before building the highlight maps, the atom and ring-shade indices refer to the final abbreviated molecule (22 atoms after both abbreviations are applied). The NHBoc abbreviation collapses 7 atoms and HOPh collapses 6, shifting the indole ring indices to [12, 13, 14, 15, 20].
Color conventions
For publication figures we prefer colors that remain distinguishable in grayscale:
- Red (
#e74c3c) for electron-withdrawing groups like carbonyls. - Blue (
#3498db) for stereocenters or other atom-level emphasis. - Green (
#2ecc71) for bonds or connections.
These are not rules, but they are conventional enough that most readers will intuit the meaning. The important thing is to be consistent within a figure and to explain the colors in a legend.
Atom-mapping numbers
Reaction schemes often need atom-mapping numbers. These should appear as small integers placed near atoms to show which atom becomes which atom across the reaction. RDKit supports this through the atomNote property on each atom. If an atom has an atomNote, RDKit draws it next to the atom label.
atom_maps = {2: 1, 4: 2, 13: 3, 14: 4, 16: 5, 27: 6}

draw_highlighted_molecule(
    SMILES,
    "molecule_atom_maps.png",
    size=(500, 400),
    atom_maps=atom_maps,
    annotation="Atom-mapping numbers for a hypothetical reaction",
)
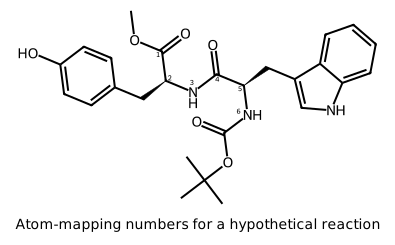
The numbers are small and unobtrusive because they are rendered by RDKit itself, not added as a separate overlay. For a reaction, you would compute the mapping from the reaction SMARTS (or annotate it manually) and pass the same numbering to every molecule in the scheme.
One caveat: atom notes and abbreviations do not combine cleanly. If an atom is consumed by an abbreviation, it no longer exists in the condensed molecule, so its note disappears. Use atom maps either on the full structure or on a drawing where abbreviations are not applied.
Legends and annotations
A figure with four different highlight colors is useless without a legend. Both draw_highlighted_molecule and the reaction composer support legends through a simple color-to-label mapping:
legend = {
    "#e74c3c": "carbonyl / acid functional groups",
    "#3498db": "stereocenters",
    "#2ecc71": "bonds to selected stereocenter",
}
The helper renders this below the molecule panel:
- For PNG, it uses PIL to draw color swatches and text.
- For SVG, it appends
<rect>and<text>elements to the generated SVG.
The result is the same visually: a row or column of color swatches with labels, aligned below the structure. The legend in the highlighted example above was produced this way.
The annotation argument adds a centered caption below the legend (or directly below the molecule if no legend is present). It is useful for one-line context such as "Atom-mapping numbers for a hypothetical reaction" or "Matched pharmacophore atoms."
Where this fits in the larger toolkit
The flow for a single molecule now looks like this:
- Start with
draw_moleculefor a clean baseline. - Add
abbreviationsif the structure is crowded with common fragments. - Add
atom_colors,bond_colors, and alegendto emphasize specific features. - Add
atom_mapsand anannotationwhen the molecule is part of a reaction analysis.
In the next post we will extend these same ideas to full reaction schemes: per-molecule highlights, global legends, and clean atom-map numbering across reactants and products.
Where to find the helper code
The helper functions used in this post are the same ones introduced in Part 3b: Highlighting and Mapping Reactions. Their full source is included in the Appendix of Part 3b. Copy that code into a single script before running the examples below.
A companion post, Part 3b: Highlighting and Mapping Reactions, applies the same ideas to reaction schemes.
The drawing helpers from this post and the next one will be packaged into a free, open-source Python library called acacia_chem on GitHub. Check back soon for the release and pip install acacia-chem instructions.